Consolidation Graph
The Consolidation Graph Report is available only with the Loan Consolidation reduction plan.
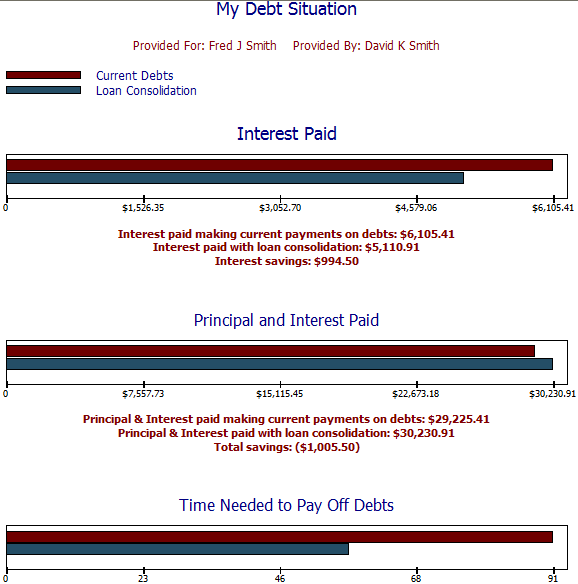
Interest Paid
This graph illustrates a comparison between the amount of interest to be paid if continuing with the current non-accelerated payoff plan versus the interest paid on a loan consolidation plan. Actual interest payments and savings are displayed.
Principal and Interest Paid
This graph shows a comparison between the amount of principal and interest to be paid if continuing with the current non-accelerated payoff plan versus the principal and interest paid on a loan consolidation plan. Actual principal and interest payments with the resulting money saved are displayed.
Time Needed to Pay Off Debts
This graph shows a comparison between the number of months necessary to pay off the debts if continuing with the current non-accelerated payoff plan versus the time it would take to pay off a loan consolidation plan. Actual months and the time saved are also displayed.